The data portal allows you to select data according to topic and by time period and geography (county, census tract, state). Data are available as tables, charts, or maps, and are available for download. The data portal allows you to select and view multiple measures at the same time. If a topic has data available in the data portal, you will see a button on the topic page that looks like this:
How to Use
When you go to the data portal, you will see a selection menu at the left side of the screen.
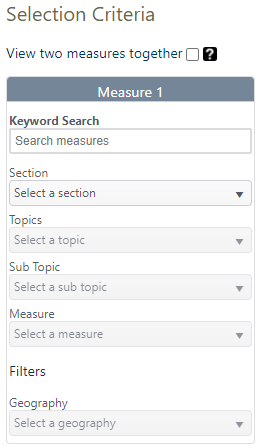
Enter a word for the measure you want to look up in Keyword search bar at the top of the menu. This will auto-populate the selection menu to navigate to that topic. It will also set filters to the largest geography and most current year of data available. You can change these filters based on which data you want to see for the measure. After you have filled out the selection menu and filters, click the green “Submit” button.

You can also fill out the selection menu directly by using the dropdown menus. This can be useful if you are familiar with how WTN data is organized, if you don't know which keyword to use, or if you want to see which data are available.
Once you click the green “Submit” button, the right side of the screen will display the data for your measure. Tabs along the top will show the formats the data are available in: table, chart, and map. Not all measures are available in all formats, but all measures are available in at least table form.
Notes Tab: The first tab on all measures is the “Notes” tab. This page shows information about how the data was created and has links to relevant information. If you use WTN data in a publication, we ask that you use the citation listed on the “Notes” page.
Table Tab: The “Table” tab shows the data as a table. Usually the top row will be the state total, and data by the selected geography will be below.
You can sort each column in ascending and descending order by clicking on the column header. When there are more rows of data than can be shown on a single page, you can navigate through pages of results by using the page arrows at the bottom of the results screen.
The “Table” tab is also where you can export data. The data will export as a .csv file, a file type which most spreadsheet programs (such as Excel) can read. To export data, click the “Export” button at the top right of the screen when you are in the “Table” tab.
Chart tab: This tab shows data in bar chart form, typically with a bar representing the state level data as a benchmark. Charts sometimes take longer to load, so be patient when you click into this tab.
Map tab: The “Map” tab shows the data in a map by the selected geography (county, census tract, etc.). To the right of the map, there is a search bar where you can enter in a specific address or zip code. The legend for the map also appears on the right.
You can adjust the transparency of the measure over the topographic map of Washington with the transparency slider below the map.
You can click on the map to see a popup box that provides more information about the measure in that location.
Below the map there may be additional overlays relevant to that measure. Not all maps have overlays. You can turn on an overlay by checking the appropriate toggle box. You can select multiple overlays at a time. Each overlay has its own informational popup boxes that will appear when you click on an overlay feature.
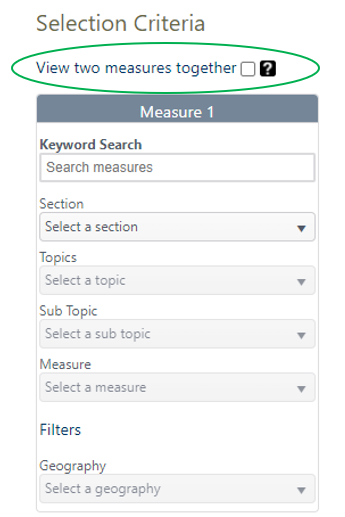
How to View Two Measures Side by Side
To view two measures side by side, check the box above the selection menu. This will bring up a second selection menu below the first. Select your topic as described above for each measure you want to look at, then click “Submit.” The tab selection at the top of the data window will apply to both measures, so you can see two maps or two tables, etc.
Privacy and Protection
To protect privacy, the data portal does not display any personally identifiable information. The data have been aggregated and de-identified in compliance with state and federal law.
Contact Us
For information or questions related to the Washington Tracking Network, email DOH.WTN@doh.wa.gov.
Let Us Know How You Used the Data
We love hearing about how our data is being used to make an impact on the health of Washingtonians. It also helps us to know what is meeting our users’ needs and how we can improve the information we provide. If you used our data, please tell us about it by sending an email to DOH.WTN@doh.wa.gov.
Would you like to receive updates?
Receive updates and information about WTN by joining our email newsletter.